Technology
finnCap Tech Chat | Back to skool
As the start of school and university rolls around after an already autumnal summer, we’ve had several conversations that have reminded us of textbooks and corporate finance lectures, on how to think about debt and public tech valuations. The theory would be that a certain level of debt can optimise the WACC and gear returns to equity, especially if there are relatively predictable, recurring cash flows. We thought to look at what we currently see in the market.
For our Tech universe of UK publicly-listed stocks, we’ve run the finnCap Tech 40 and Next 50 indices for the past 7 years, which gives us an ample source of data to look at. As we break out in more depth on our recently launched Tech Hub, our indices look at the 90 largest Tech stocks with a market cap of under £1.5bn in London, and on the site we chart the valuation, growth rates, and price performance for the indices and their sub-sectors. That’s alongside Demos of what our corporates do, our free-to-all research on all our corporates, a calendar of upcoming and past events for all of the companies we follow, and a library of our previous tech chats.
When we freeze the valuation data as of yesterday, the chart below highlights that leveraged tech stocks within the Tech 40 and Next 50, are typically facing a ceiling on their 12-month forward EV/EBITDA. (Net cash/EBITDA is negative on the x-axis below, Net debt/EBITDA is positive, and we only include stocks with 12-month forward forecasts):

What is noticeable is a) the relative lack of companies that have any gearing at all, such as the current preference for the ungeared balance sheets, but also b) that most companies with net debt/EBITDA, as opposed to net cash, have EV/EBITDA multiples of
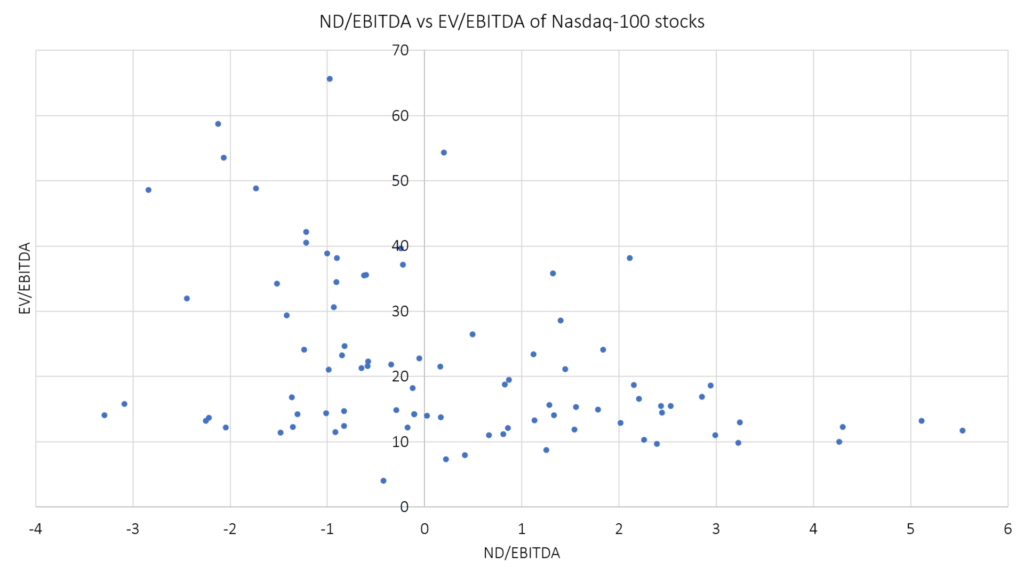
Admittedly, the range of UK tech stocks with leverage is limited, so to highlight the situation for larger stocks from the predominantly tech-exposed Nasdaq-100:


